Analytics
Players, live activity, audience, retention, acquisition and connections — analytics built into every network, no plugin needed.
Infinity-Filter ships with deep analytics built into every network: players online, new and returning players, countries, versions and domains, retention cohorts, blocked vs. allowed connections, latency — all of it in the panel, without any plugin to install on your backend.
Where to find it
Open Network → Analytics. The page has six tabs:
Overview The key numbers of the period, the activity and the players online.
Live The last hour, minute by minute, refreshed every few seconds.
Audience Who your players are: new or returning, when they play, countries, domains, versions, Java or Bedrock.
Retention Which new players come back: cohorts, retention curve, retention by segment.
Acquisition Where the new players come from, and whether they stay.
Connections What the protection blocks and lets through, and the latency to your servers.
Overview and Connections come with every paid plan; Live, Audience, Retention, Acquisition and the filters from the Pro plan. On a plan without them, the tab shows an example with an Upgrade plan button.
Period, interval and filters
- Period (top right) — a preset like Last 7 days, or your own range. Every number is compared to the previous period of the same length.
- Interval — the step of the charts (5 min to 1 month); Auto picks one for the period.
- Filters — platform (Java / Bedrock), countries, domains, versions, and new or returning players. They apply to the whole page, except the connections and the players online. Clicking a country or a domain in a chart filters the page too.
On each chart, the list icon shows the data as a table, the download icon exports it as CSV, and dragging over a time chart zooms in. When a chart has several curves, its legend is interactive: hover a name to highlight its curve, click it to hide or show it, double-click it to show it alone.
Overview
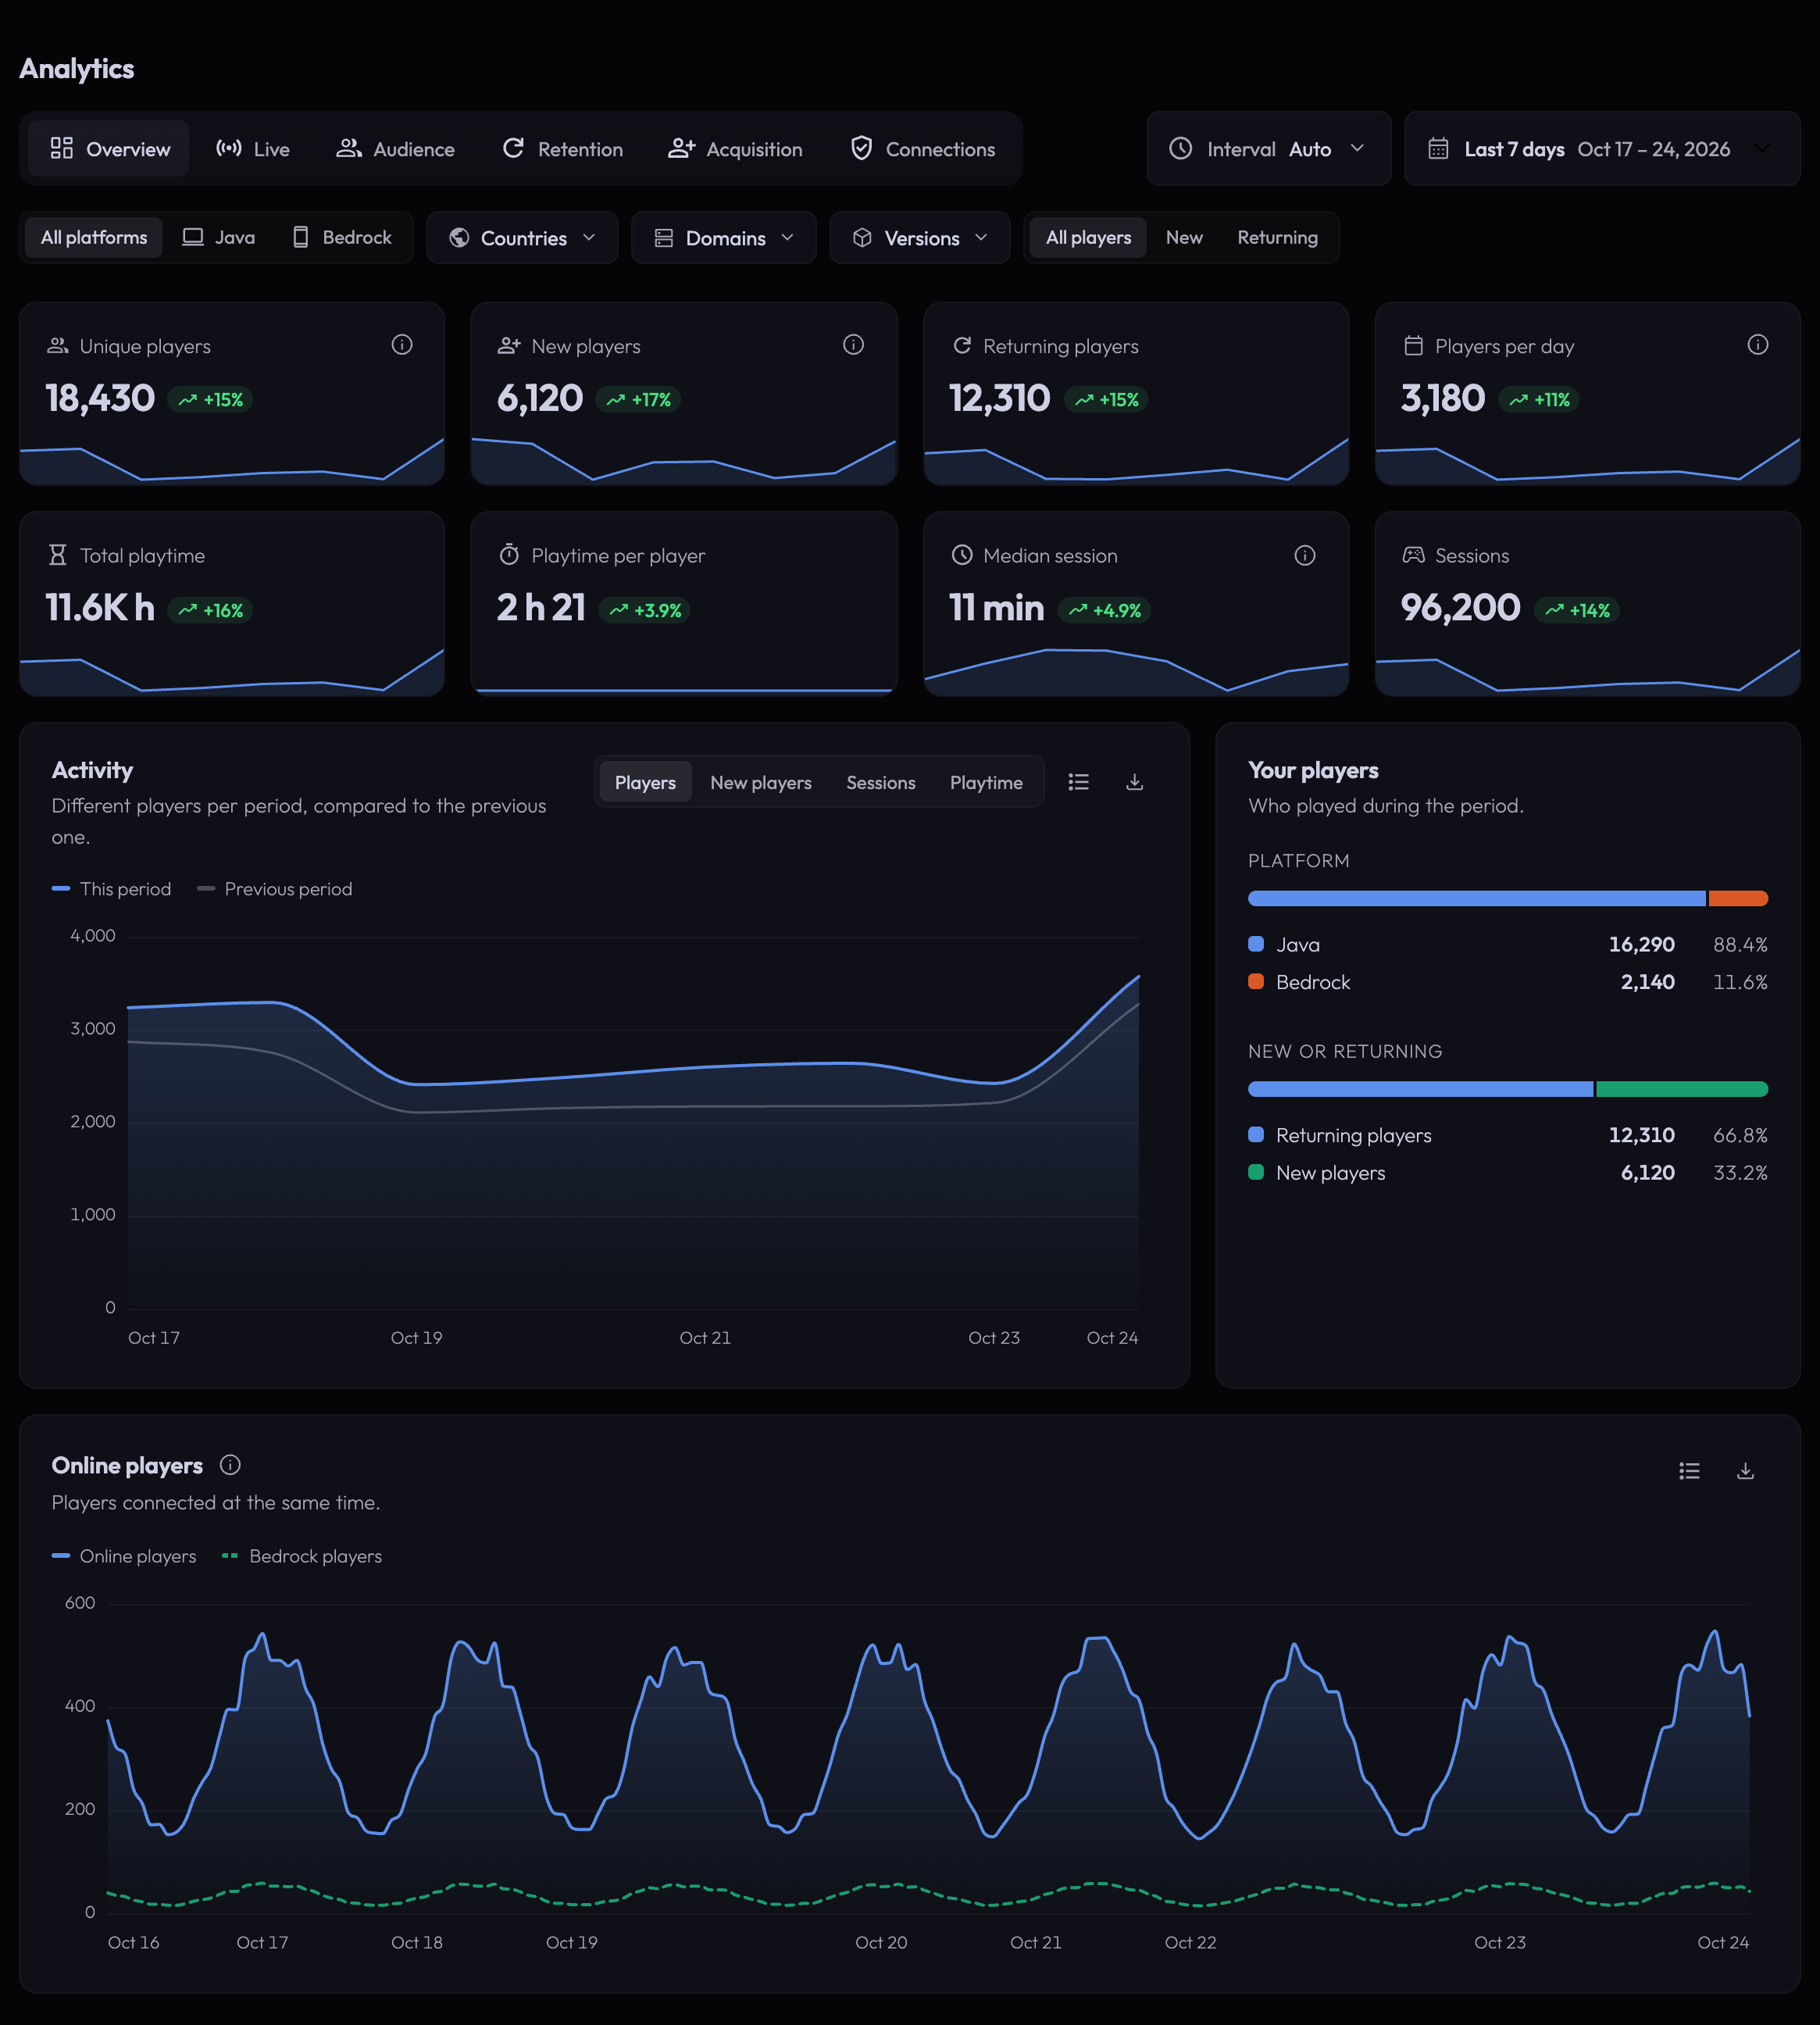
- Key numbers — unique players, new players, returning players, players per day, total playtime, playtime per player, median session and sessions, each compared to the previous period.
- Activity — players (or new players, sessions, playtime) per day, against the previous period.
- Your players — Java vs. Bedrock, new vs. returning.
- Online players — players connected at the same time, with the Bedrock ones. Measured every minute and kept 30 days.
Live
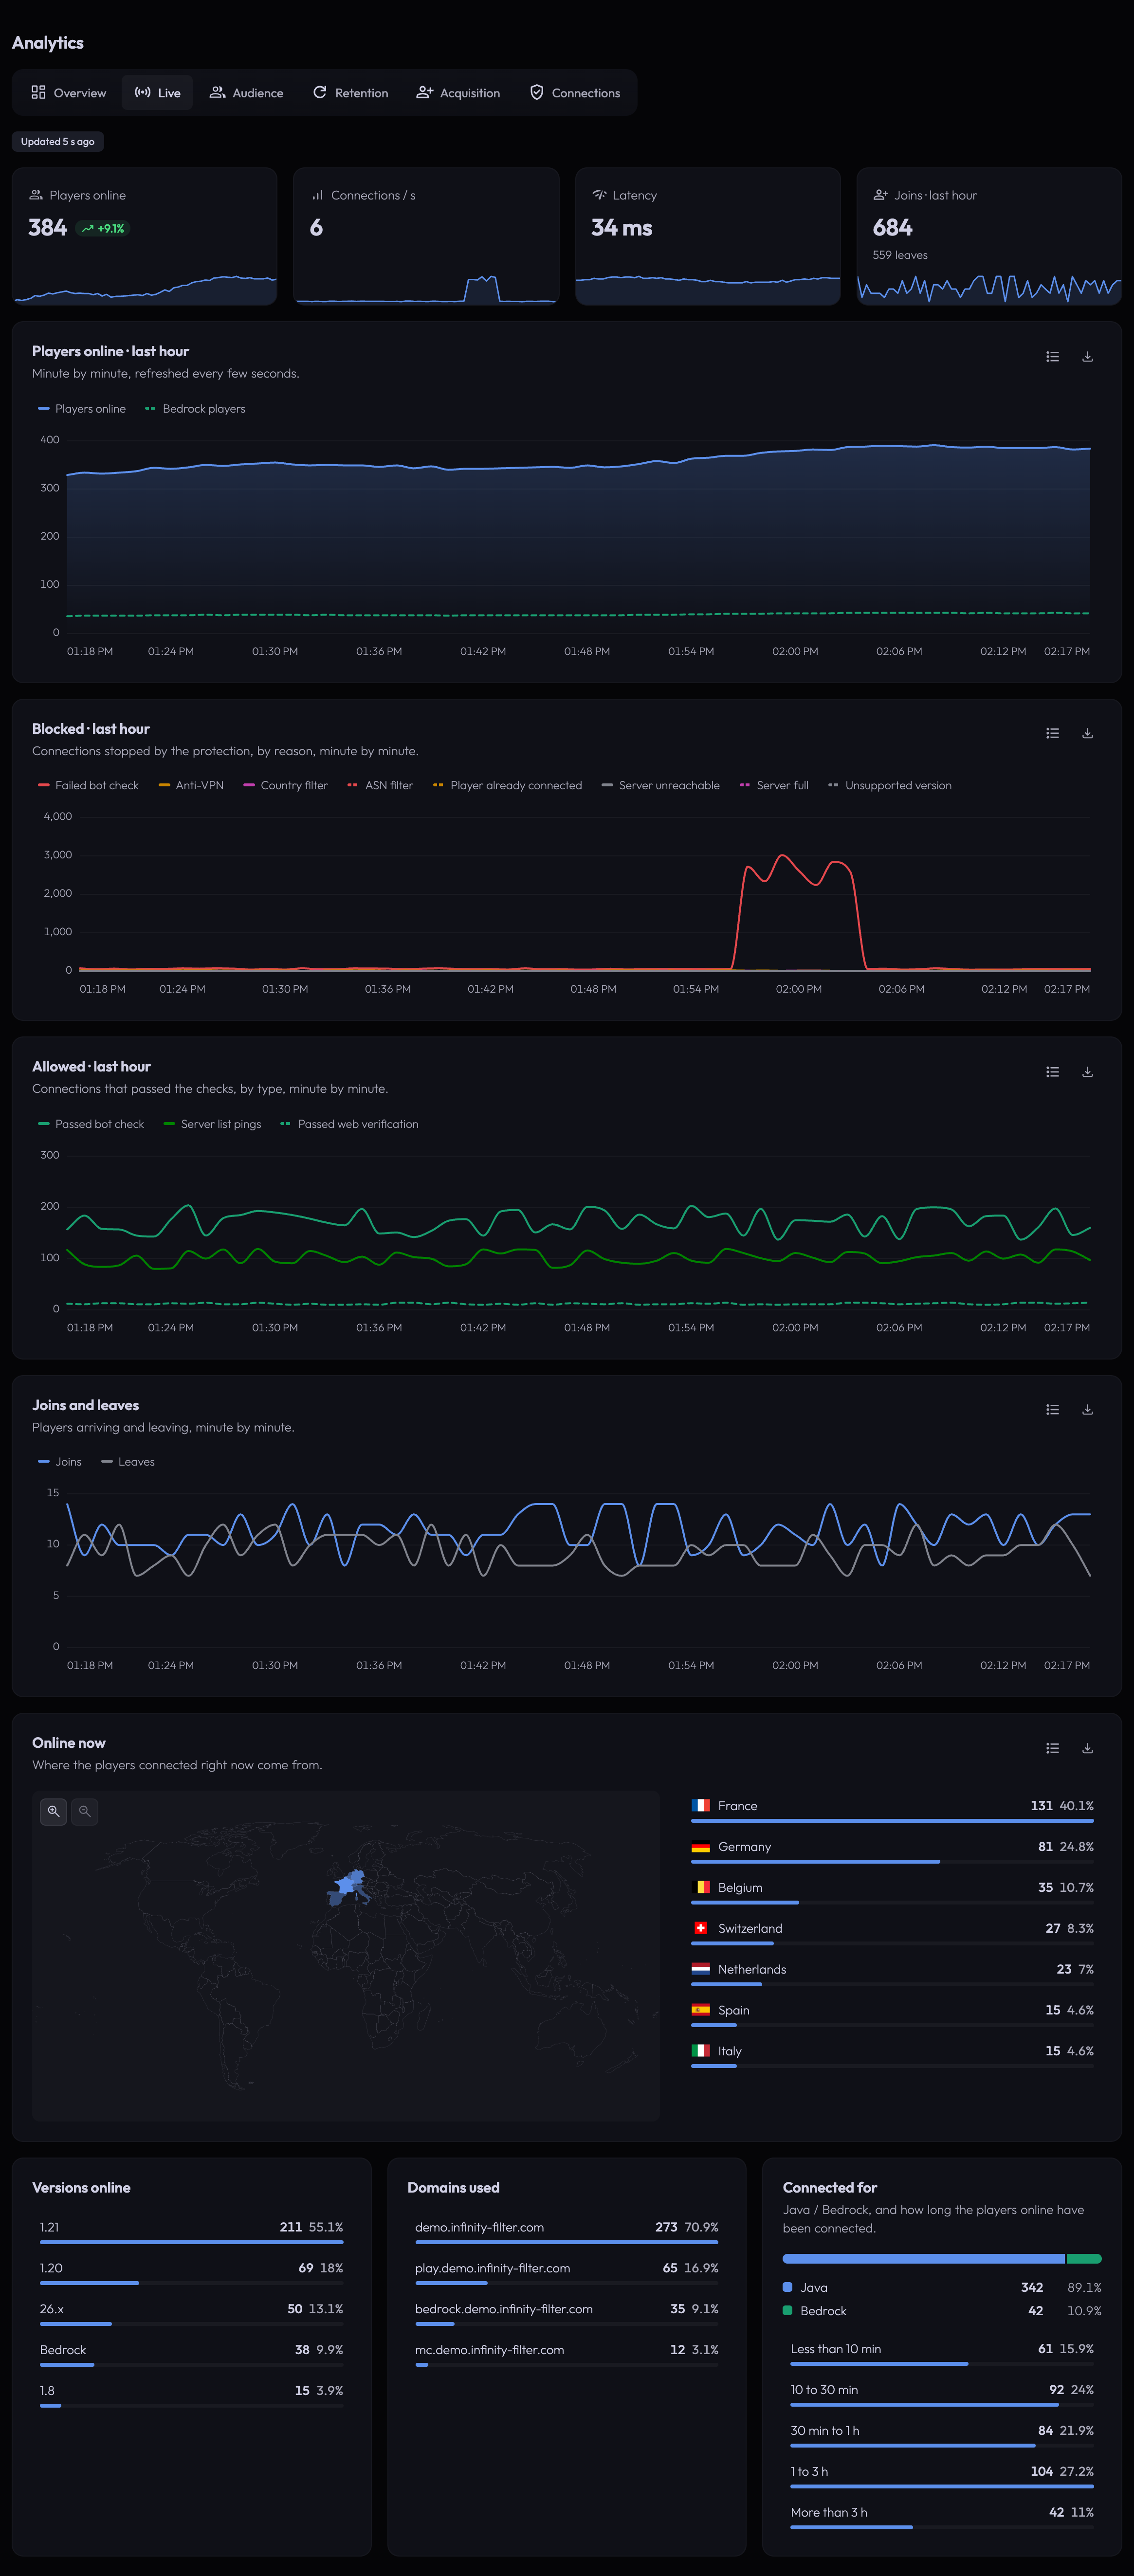
Players online (compared to the same time yesterday), connections per second, latency, joins and leaves over the last hour, the connections blocked (one curve per reason) and allowed (one curve per type) minute by minute — and Online now: the countries, versions, domains, platforms and connection times of the players on your server right now.
Audience
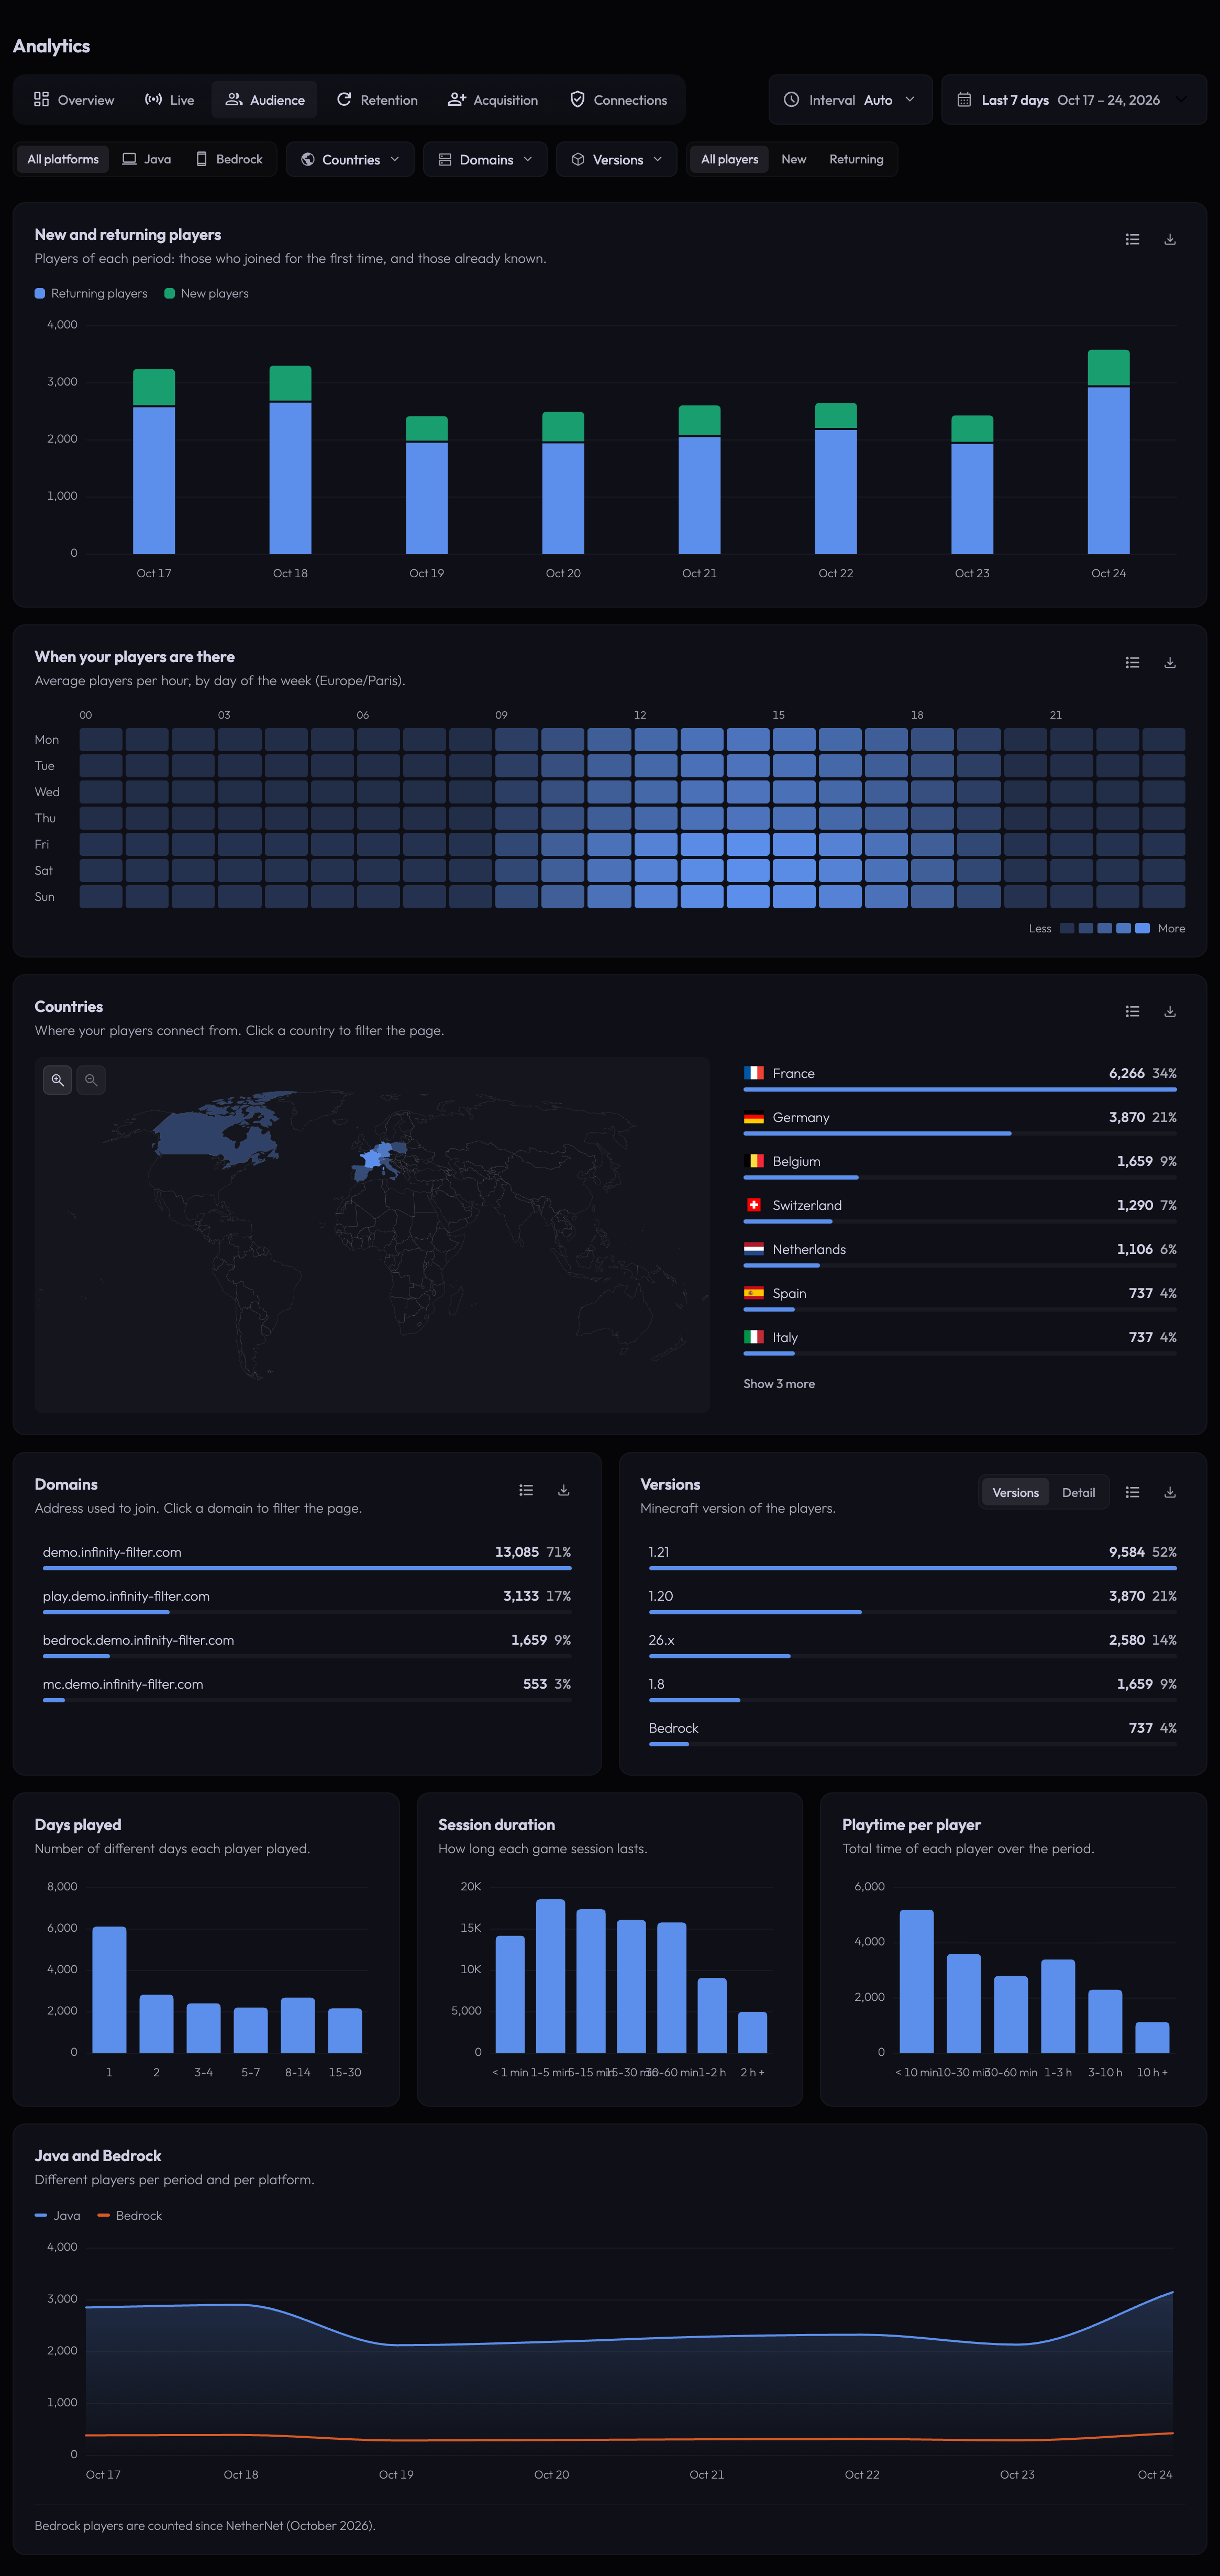
- New and returning players per period.
- When your players are there — average players per hour, by day of the week, in your time zone.
- Countries (map and list), Domains used to join and Versions (grouped, or in detail).
- Days played, Session duration and Playtime per player distributions.
- Java and Bedrock — players per period and per platform. Bedrock players are counted since NetherNet (October 2026).
Use this tab to answer “who plays on my server, from where, on which version, and when”.
Retention

- Back after 1 / 7 / 30 days — the share of the new players of the period who played again at least that many days after their first connection (choose a long enough period for 30 days), and the playtime per new player.
- Cohorts — the new players of each day, week or month, and the share who came back in the following ones. The colour intensity scales with the retention.
- Retention curve — the share of the new players still playing after some days.
- Retention by segment — by country, platform, version or entry domain: which new players come back the most.
Use this tab to answer “is my community growing or churning”.
Acquisition
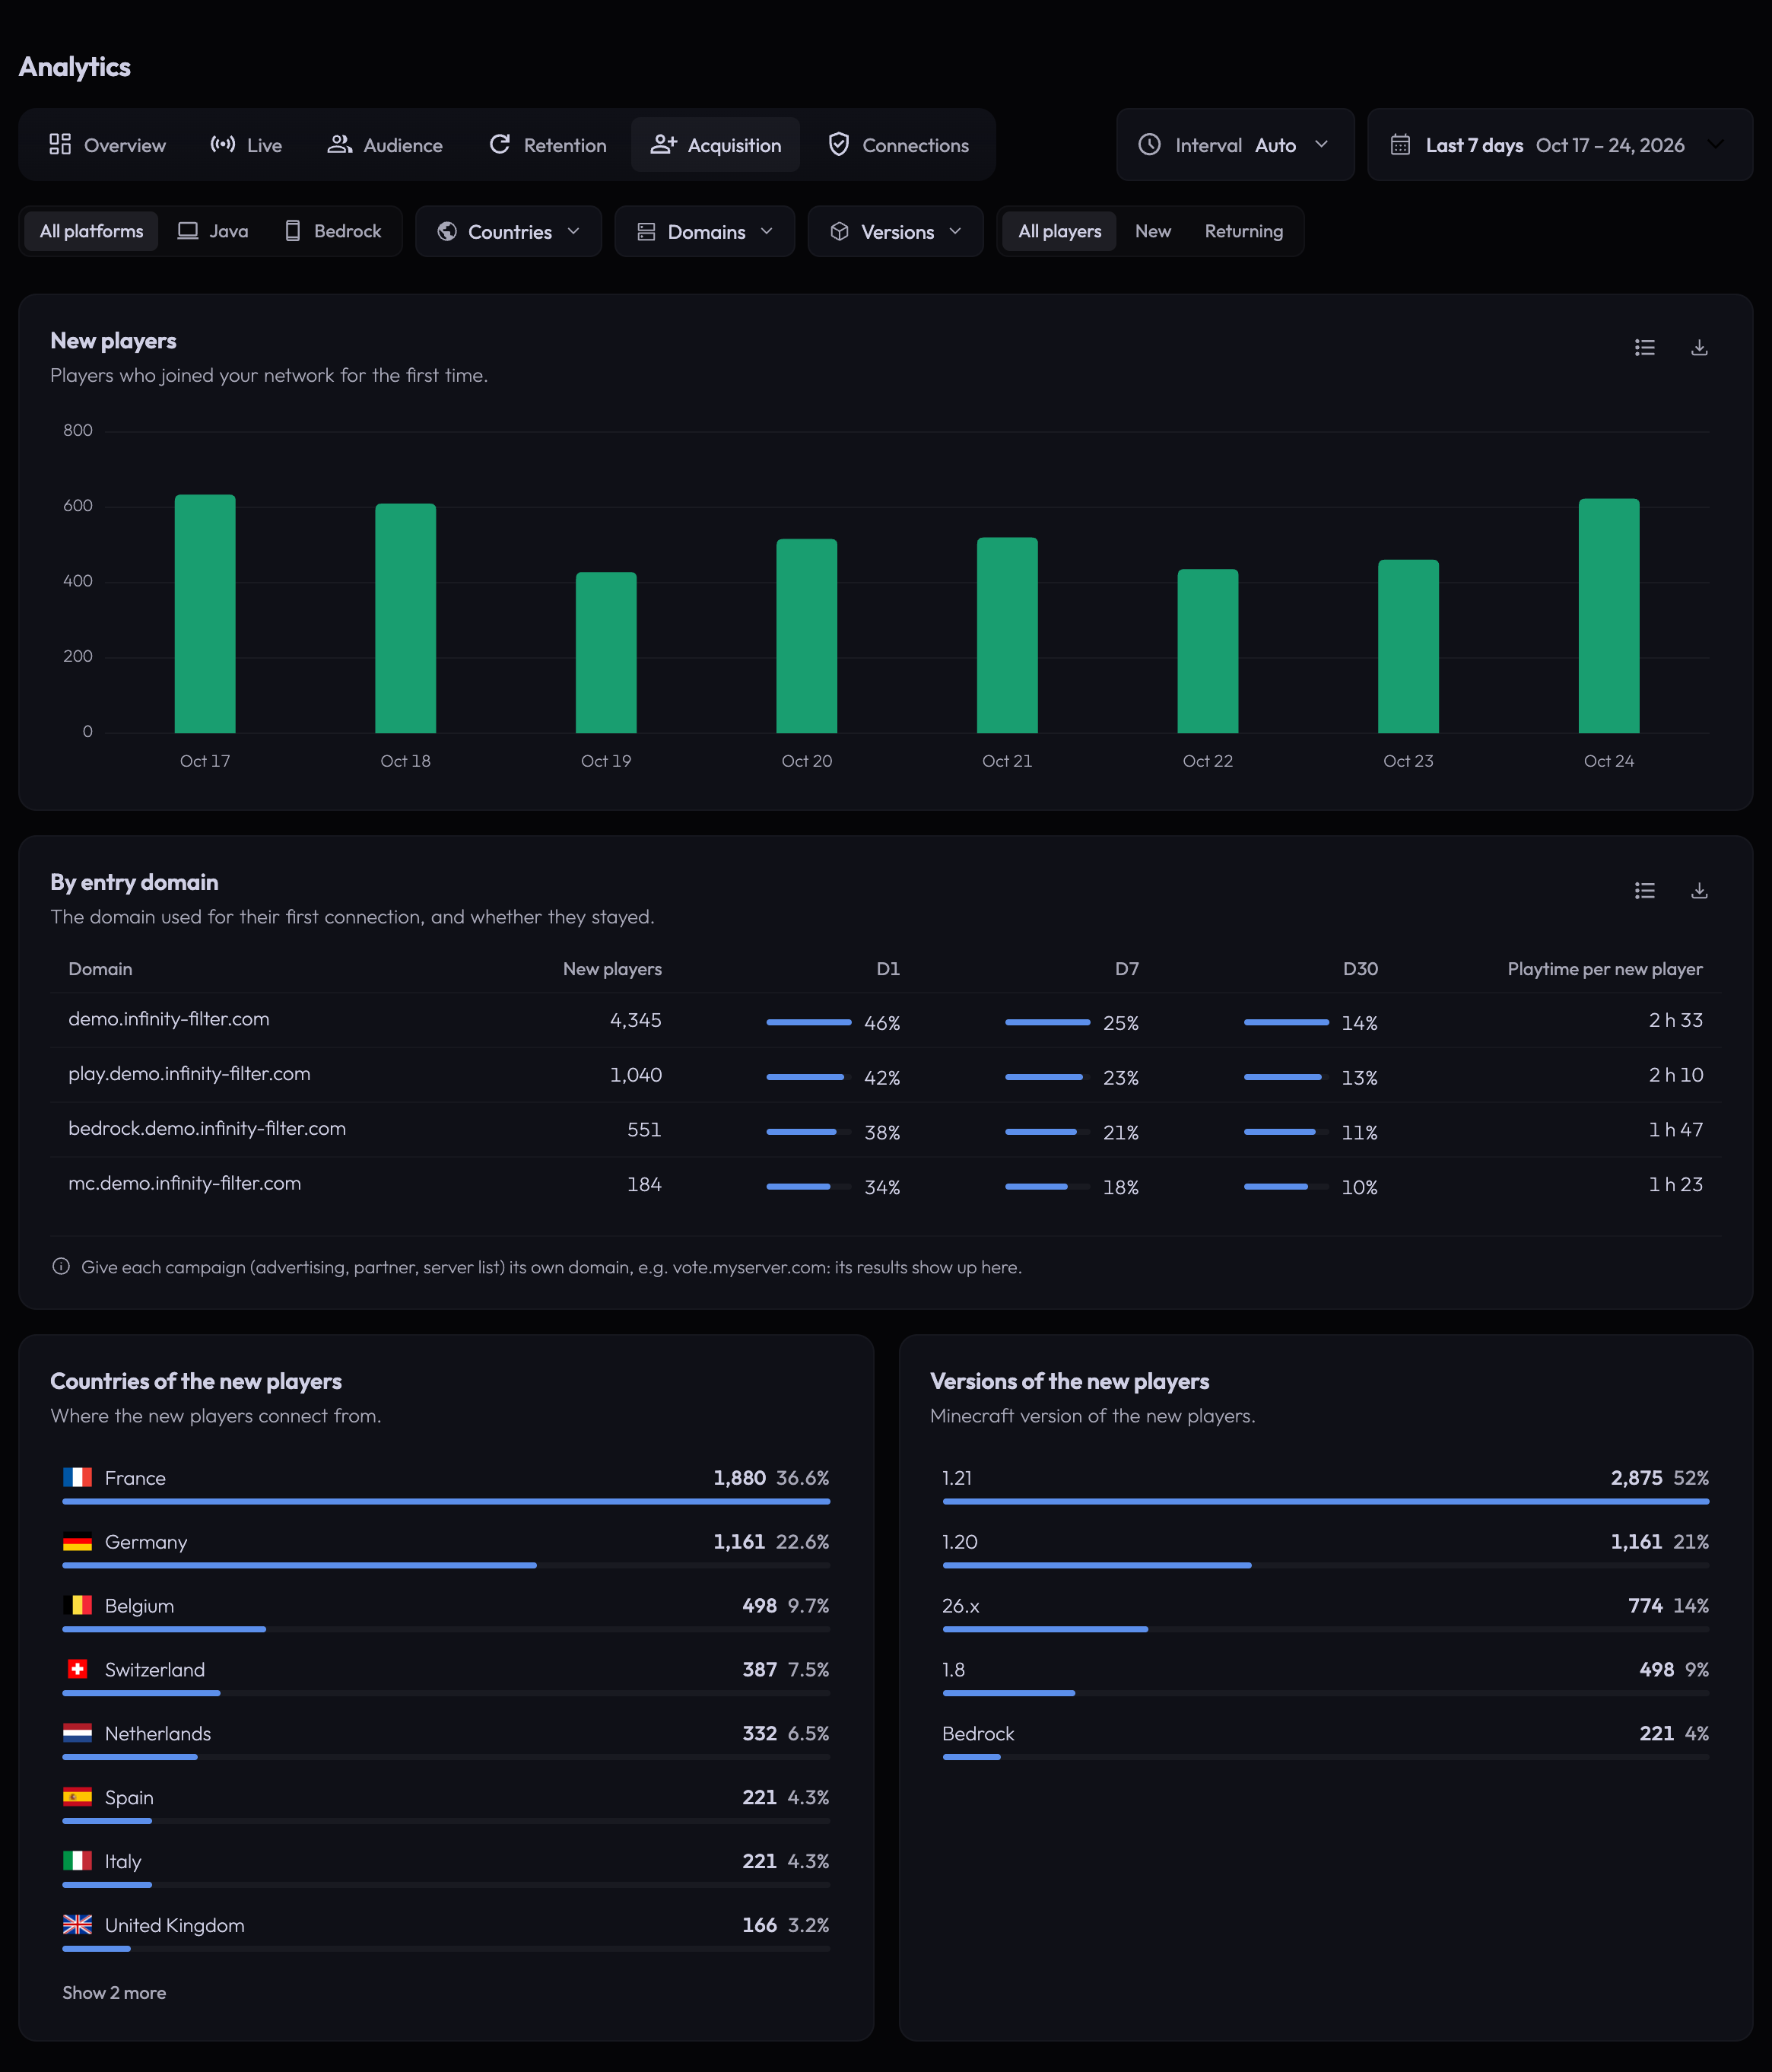
- New players per period.
- By entry domain — the domain of their first connection, and whether they stayed (D1, D7, D30, playtime). Give each campaign — advertising, partner, server list — its own domain (for example
vote.example.com): its results show up here. - Countries and Versions of the new players.
Connections
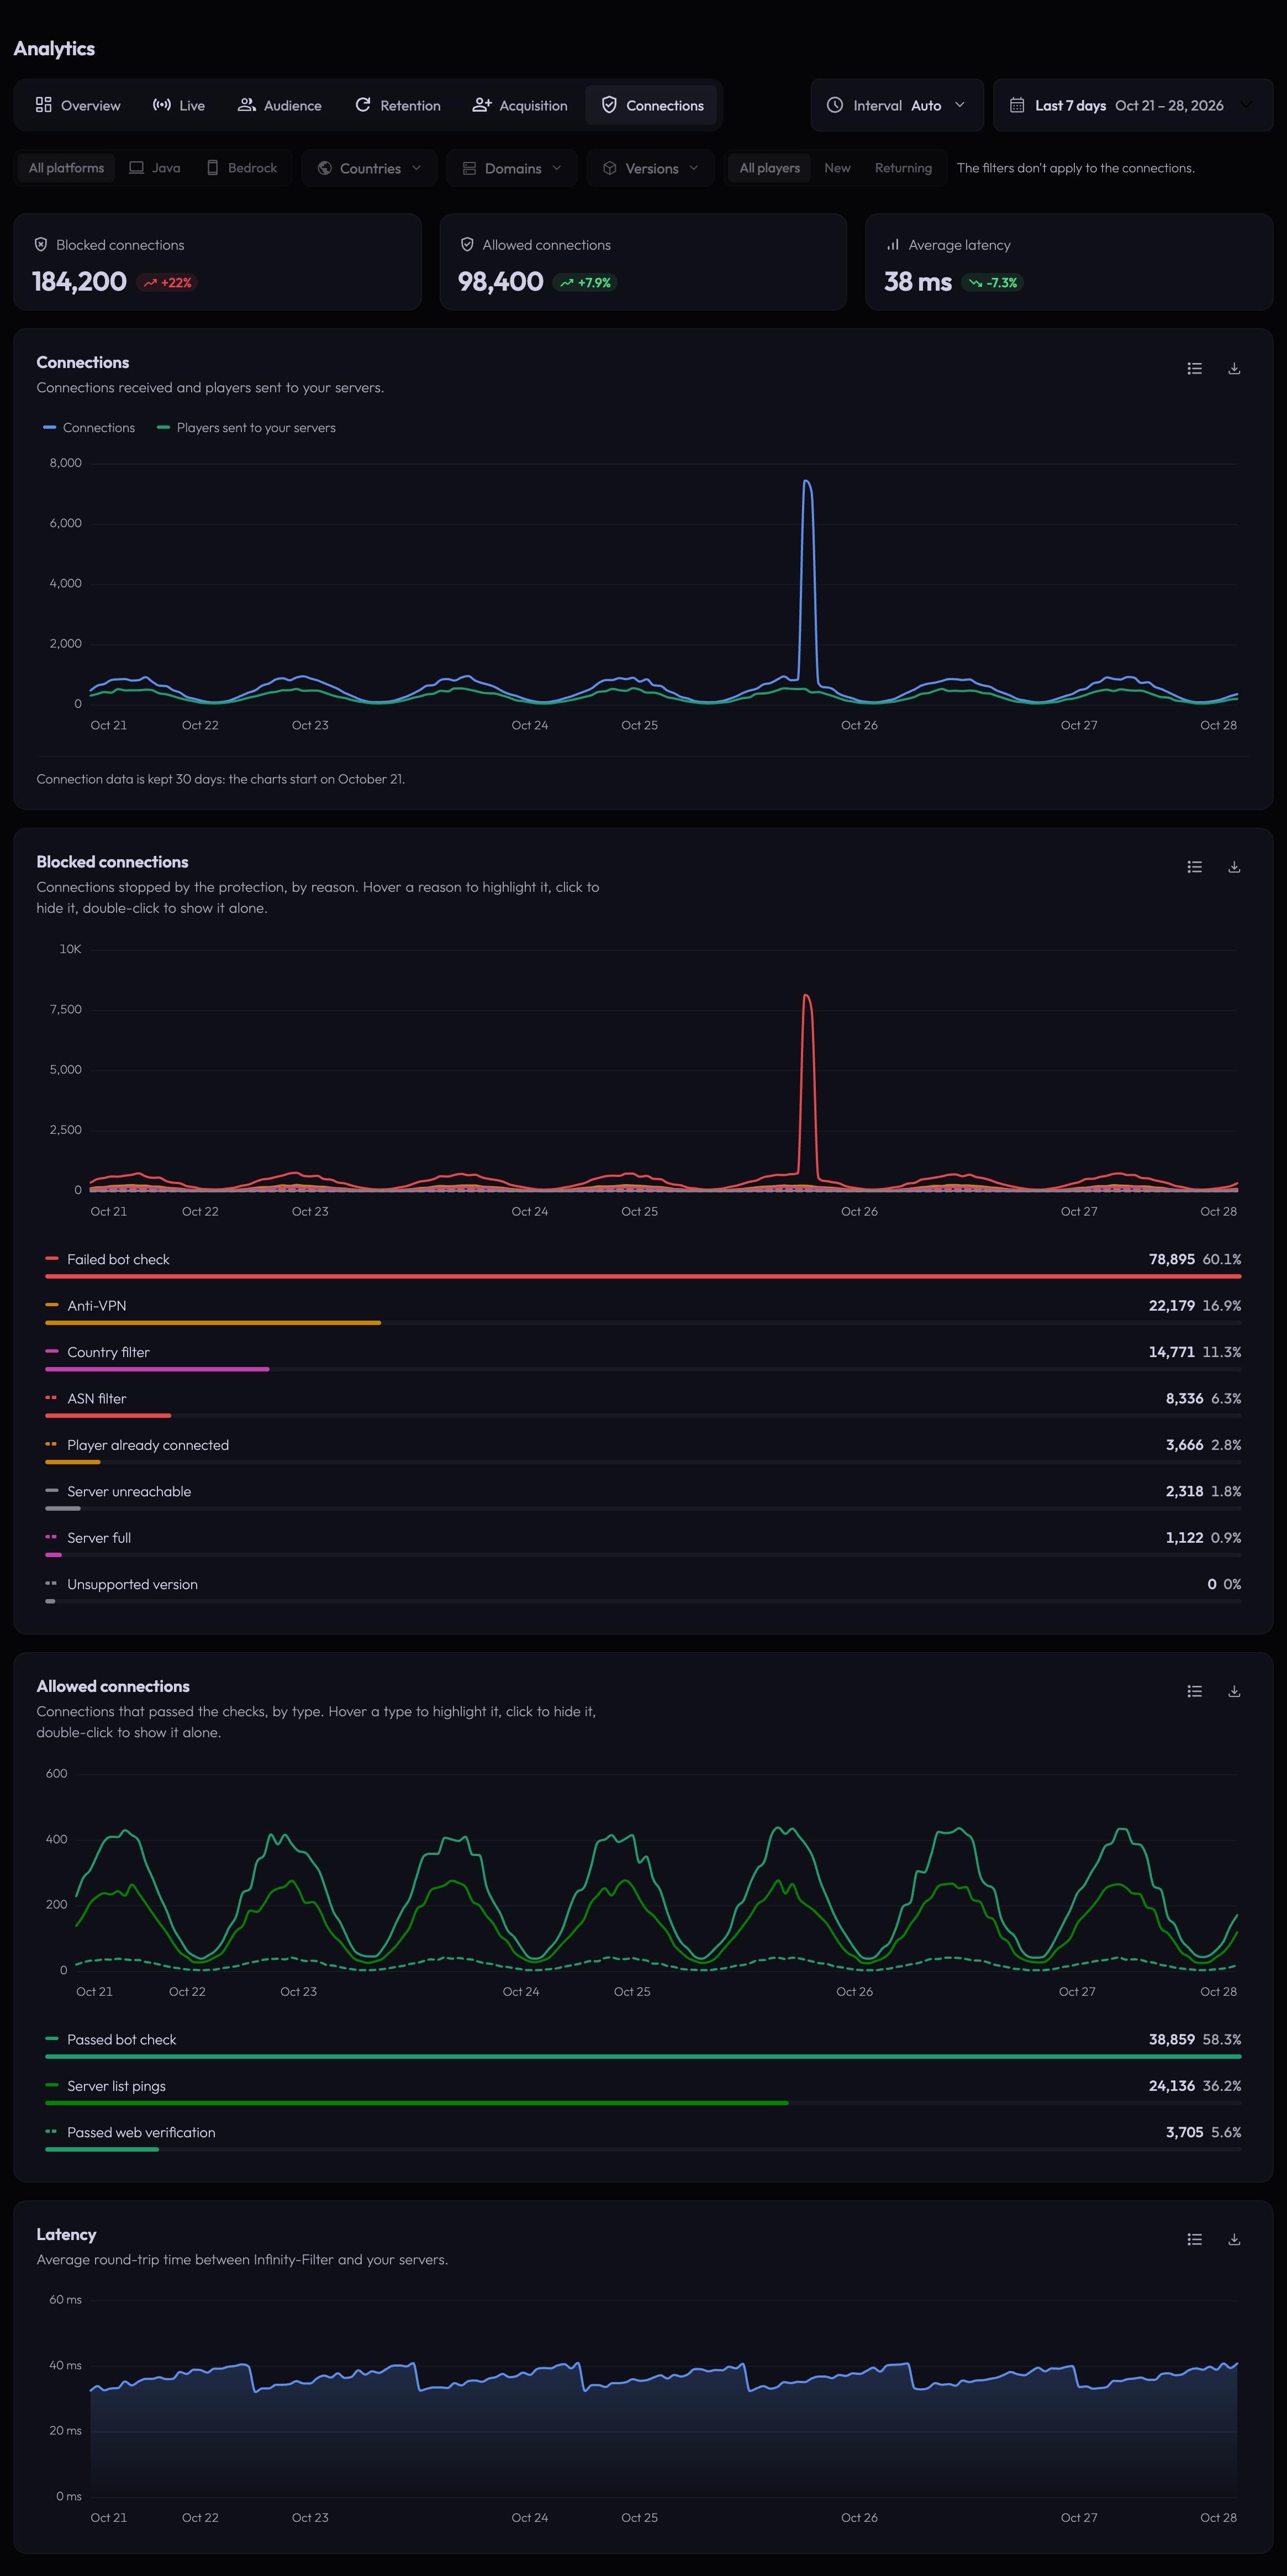
- Blocked connections, Allowed connections and Average latency over the period.
- Connections — connections received and players sent to your servers.
- Blocked connections — one curve per reason: failed bot check, Anti-VPN, country filter, ASN filter, player already connected, server full, unsupported version, and server unreachable (your server didn’t answer). Every reason is listed, even at 0.
- Allowed connections — one curve per type: passed bot check, server list pings, passed web verification.
Under each chart, the list gives the total and the share of each type, with its color. It is the chart’s legend: hover a type to highlight its curve, click it to hide or show it (the scale adapts), double-click it to show it alone.
- Latency — the average round-trip time between Infinity-Filter and your servers.
Connection data is kept 30 days, and the filters don’t apply to it. Use this tab to answer “what is Infinity-Filter dropping, and what is it forwarding”.
Programmatic access
Every metric on the panel is also exposed via the public API. Use it to feed your own dashboards (Grafana, internal admin panels, …).
What’s next
Last updated: October 24, 2026